Loggregate - Log file analysis
2024-12-01

Never have I ever thought that I'd write two articles back to back about logging given how much I hate the topic. Logging is one of the boring things to do in software development. I'd rather just write code and try to get the app working than yapping about what the app was doing into some log files. But, it is absolutely necessary to write logs in a software for all the reasons mentioned in the Logging 101 post. Especially if the application is important we definitely want to have logging in that application, you are free to define what an important application should be.
Inspiration
There is a product in Microsoft Azure called Azure Monitor. This product is very well known for collecting logs from the applications and analysing them. It also provides insights on application performance, creates charts, sends notifications with alerts, and more.
It's very cool but not every application runs in that particular environment and we cannot write logs from all applications to Azure monitor. Also there are all kinds of software that we use that just log to files like Nginx, PostgreSQL and etc.,
So I thought it would be cool if we have an application that analyzes, aggregates and make reports based on the log files that are not on cloud. Then I started working on Loggregate project.
Loggregate
Loggregate is a name I came up with by combining Logs + Aggregate. Loggregate is open-source, licensed under GPLv3 licensed, with it's source code available on GitHub. Loggregate is a command line tool, and it takes glob pattern as input and generates a report on the log files given as a html file which you can open and view in a browser.
Example usage:
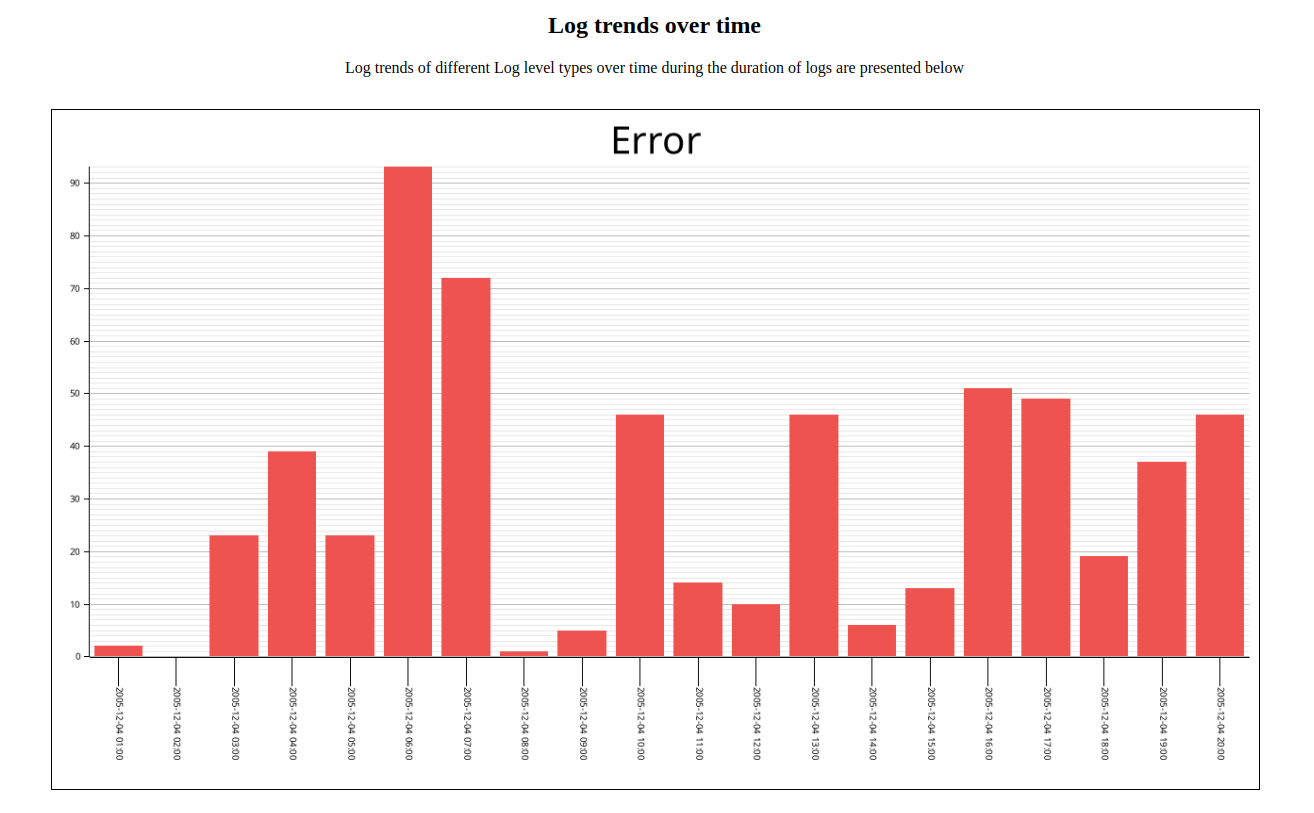
loggregate --datetime-format "%Y-%m-%d %H:%M:%S" --user "John Doe" "/var/log/*.log"That's it and you will get a pretty nice looking (in my opinion) report in html part of which looks like the image at the top of this page.
The program needs two required inputs and one optional input.
Required Inputs
- Datetime format
- Glob Pattern
Optional Inputs
- User's name
The datetime format is a very important input since the core logic of Loggregate depends on datetime, we will discuss the details below in the Algorithm section. Glob pattern of course is needed to specify the log files that we want Loggregate to analyse. The User's name is optional, if given it will be mentioned in the report produced by Loggregate.
Design Choices
Language
I chose rust to write this program. My initial choices were C++ and rust since I want a language with low level control since there are quite a
few file read and writes and I wanted language which can make syscalls efficiently. C is out of question since I wanted to be sane after writing the
program. I decided on rust since I was learning rust at that point of time and I wanted to use it.
Plotting Library
I used Plotters library to make the charts and graphs for this application. Because the API looked quite similar to Matplotlib, which I've used previously with Python. But, this library is a bit more verbose compared to Matplotlib.
Why HTML?
In the end, this application provides a visual representation of log analytics. My professional career majorly consists of web development.
So HTML is the easiest way for me to represent something visually.
Algorithm
First of all, this program assumes that every line in the log file has datetime and log level somewhere in it.
- The log files are read one by one which satisfies the given glob pattern. Each line is read and stored inside a vector of strings.
- Then the program extracts datetime and log level using regular expressions. This is where the datetime format input comes into play. The program
builds a regex patten based on the datetime format given visit Loggregate github repo to get details on how to make the datetime format.
Log levels are also matched using regular expressions. Entries that do not match predefined log levels are categorized as
other. - Then we find the minimum and maximum datetimes found across all the log files.
- Then the program decides the scale at which it should aggregate the logs, we use the min and max datetimes we found earlier to calculate the total
duration through which the logs are generated.
If there are logs for more than
one minute, program aggregates the logs in terms ofminutes, If there are logs for more thanone hour, program aggregates the logs in terms ofhoursand so on. The maxinum scale is inyears. - Then the logs are aggregated in terms of scale decided on earlier. For example, if the scale of aggregation is in terms of days, all the different log levels found within day 1 are counted and stored, then day 2 and so on till all the logs done.
- Then we make the plots for each log level and a plot for showing counts of all log levels together. All of these logs are stored in
/tmp/loggregate/plots, we store everything in/tmpbecause we don't want to pollute other directories while the program is still actively running, we only copy these files to destination after the program runs successfully. - Now the report is made by reading the html template from the
assetsdirectory and it's content is modified to make the report with the data. And file is stored in/tmp/loggregate - With the the program is almost complete and the only part remaining is to copy the report and plot images to the current directory from where the loggregate is run.
Thank you for reading this post, give Loggregate a try.